 NexBrowser指纹浏览器-官方博客Blog
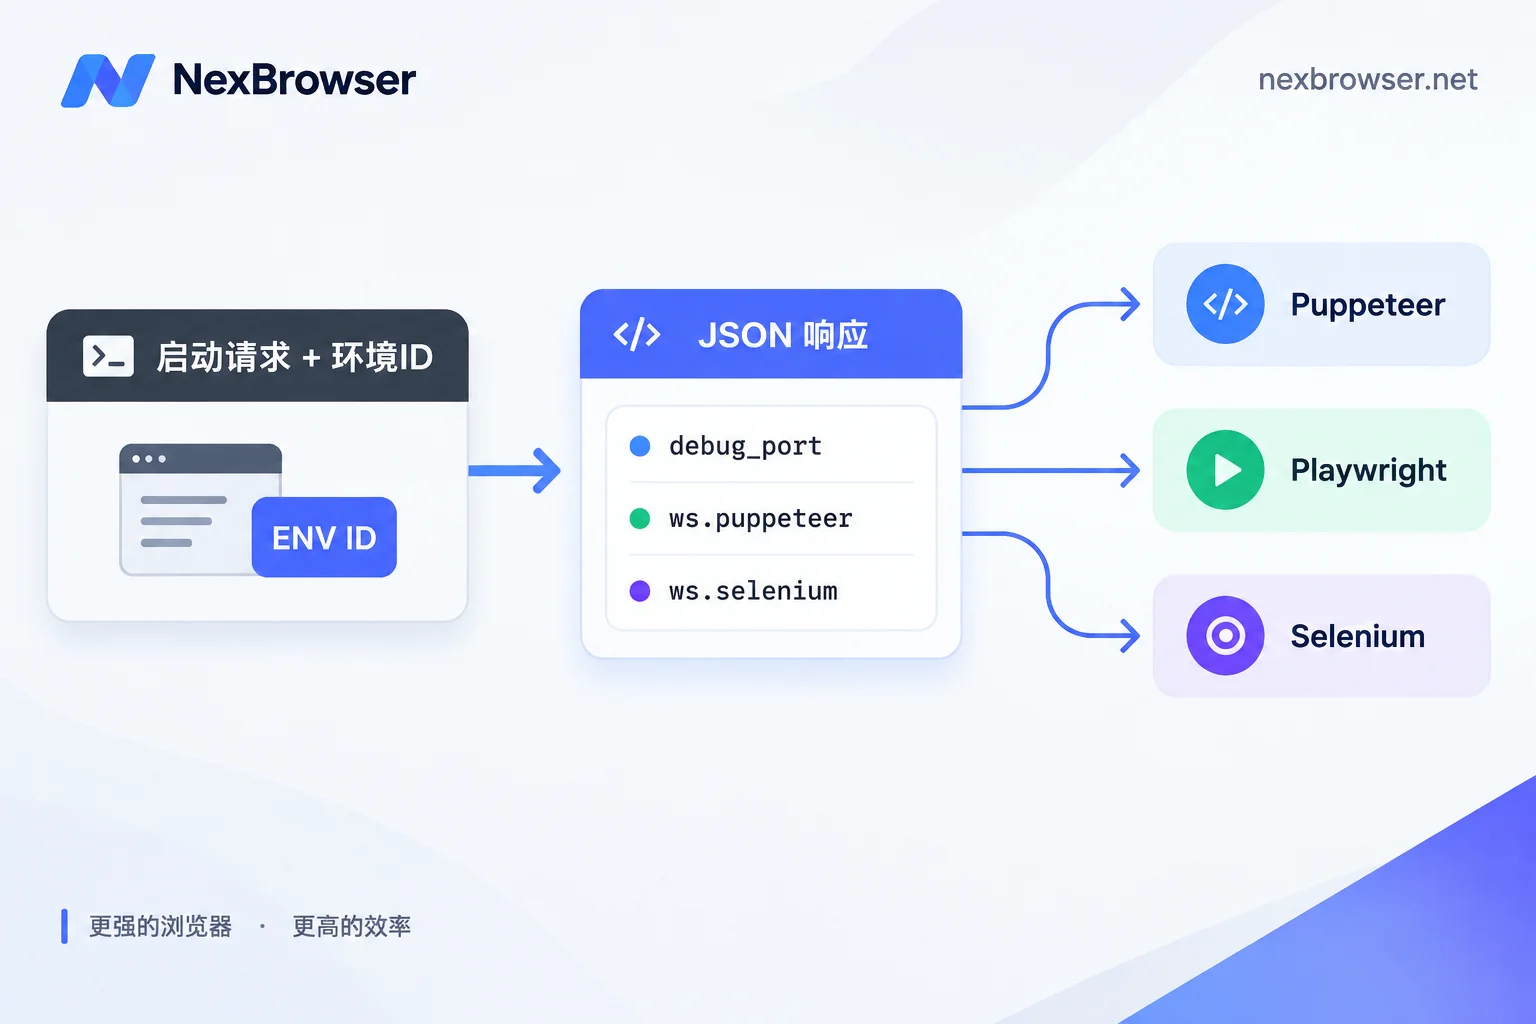
The whole chain has only five steps: confirm the local API service is running → call the launch endpoint with the environment ID → extract the debug port and WebSocket address from the returned JSON → use that address to connect the automation framework → call the stop endpoint to reclaim the process. The difficulty isn't in writing the request, but in two details that easily cause failures: the port is dynamically allocated each time, so it cannot be cached; and a successful API response doesn't mean the kernel can accept connections yet.
Let's go through them in order.
First, confirm where the API service is and whether it's reachable
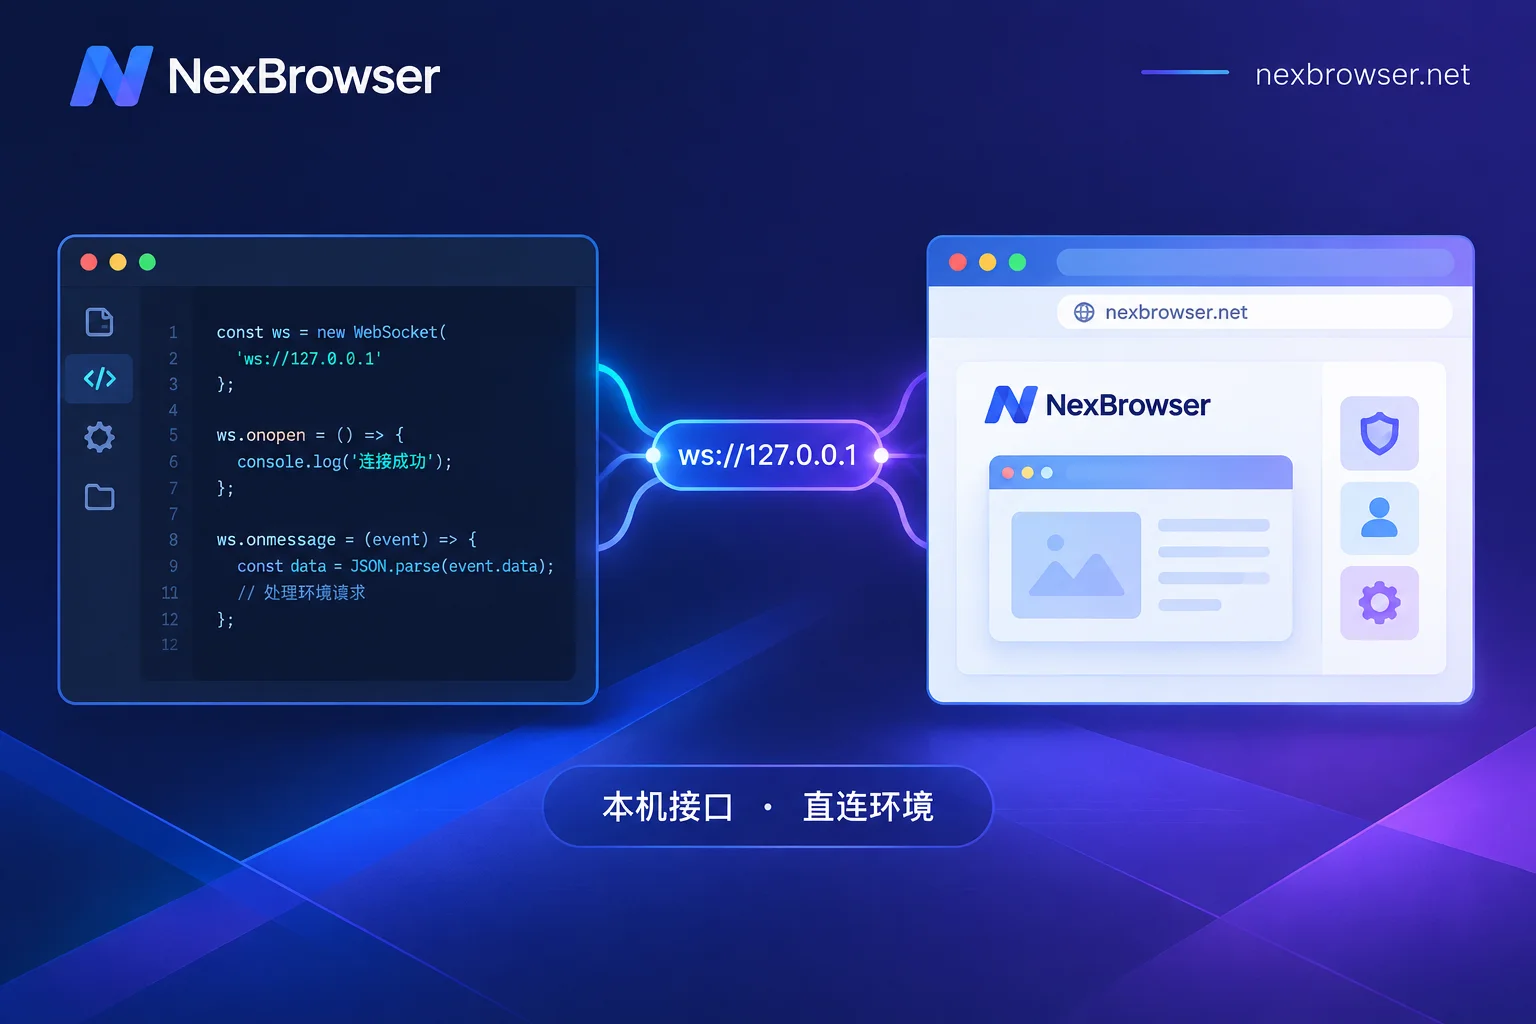
The Local API is not a cloud API; it's an HTTP service opened by the client locally, listening on the loopback address (127.0.0.1) by default. This means three things:
- The client must be running for scripts to call it; if the client is closed, the API is gone.
- The request address cannot be replaced with a public domain or LAN IP. To trigger from another machine, the correct approach is to run the script on the machine where the client is installed, or set up local forwarding on that machine, rather than exposing the API.
- The listening port is determined by what's shown in the client's settings. Different products have different default ports and route prefixes, so copying port numbers from another product's documentation will likely fail to connect.
Before starting, do a connectivity self-check: request the API address provided by the client (many clients offer a status or health-check route) in a browser or with curl. Once this passes, you can be sure that any subsequent failure is not due to the service not running. If the client has an API switch or API Key, enable it and copy the key here as well.
What to pass to the launch endpoint
The launch request is usually a GET or POST, and only one parameter is required: the unique ID of the target environment. In different products it's called profile_id, user_id, or env_id. The value can be copied from the client's environment list, or you can first call the environment list endpoint to filter by remark name—the latter is better for batch scripts, avoiding hardcoding a string of IDs.
Add optional parameters as needed. Common ones include:
- Headless mode switch: turn on for pure data collection tasks, turn off when human intervention or debugging is needed.
- Auto-open page after launch: during debugging, you can have it open a fingerprint/IP detection page to visually confirm the environment started correctly.
- Window size, whether to load extensions, and other launch parameters.
import requests

BASE = "http://127.0.0.1:<客户端设置里显示的端口>"

resp = requests.get(f"{BASE}/<客户端文档给出的启动路由>",
                    params={"user_id": PROFILE_ID})
data = resp.json()
For route paths and field names, refer to your client's API documentation. This article only defines the structure.
Which fields in the response are useful
After a successful launch, the returned JSON contains the core debug connection information, typically including three types of values:
debug_port: Chromium's CDP debug port number, e.g.,50123.ws.puppeteer: The complete WebSocket debug address, likews://127.0.0.1:50123/devtools/browser/xxxxxxxx.ws.selenium: A debuggerAddress string like127.0.0.1:50123.
Some clients also return the path to a webdriver executable matching the current kernel version. When using Selenium, prefer that path—it saves you from a pile of version mismatch errors with chromedriver.
These three values change on every launch. The port is dynamically allocated by the system, and the browser ID in the WebSocket address is unique to each process. Hardcoding the port from a previous successful run will either cause a connection error to an empty port next time, or worse—connect to an instance of another environment and run scripts for account B on account A's browser. So the flow must be: launch each time → parse response → connect using the address returned this time.
How to connect each of the three frameworks
Puppeteer uses connect, passing the WebSocket endpoint:
const browser = await puppeteer.connect({
  browserWSEndpoint: wsEndpoint,
  defaultViewport: null,   // 别让 Puppeteer 覆盖环境自带的窗口尺寸
});
const pages = await browser.pages();
const page = pages[0] || await browser.newPage();
It's recommended to keep defaultViewport: null. The default value changes the viewport to 800×600, but the viewport size must match the environment's screen parameters.
Playwright uses connectOverCDP, passing either the ws address or http://127.0.0.1:{debug_port}:
const browser = await chromium.connectOverCDP(`http://127.0.0.1:${debugPort}`);
const context = browser.contexts()[0];          // 用已有上下文
const page = context.pages()[0] ?? await context.newPage();
The most common mistake here is casually writing browser.newContext(). A newly created context is a clean session; the environment's logged-in cookies and local storage are not in it, so the script will behave as if "logged in but asked to log in again." When taking over an existing browser, using contexts()[0] is correct.
Selenium goes through debuggerAddress:
from selenium import webdriver
from selenium.webdriver.chrome.service import Service

options = webdriver.ChromeOptions()
options.add_experimental_option("debuggerAddress", f"127.0.0.1:{debug_port}")
driver = webdriver.Chrome(service=Service(webdriver_path), options=options)
Note that in this mode Selenium "attaches" to an existing process rather than launching the browser itself, so adding launch arguments (e.g., --proxy-server) to options won't take effect—the proxy is the environment's own configuration, injected by the client at launch.
Add a readiness check to avoid half of the mysterious errors
A successful launch API response only means the client accepted the command; the kernel process may still be initializing. If the script connects immediately, it may encounter ECONNREFUSED or handshake timeouts, and such failures are probabilistic—they pass when the machine is idle but fail every time when launching in bulk.
The safe approach is to poll Chromium's built-in version endpoint before connecting, and proceed only when it returns normally:
import time, requests

def wait_cdp(port, timeout=20):
    deadline = time.time() + timeout
    while time.time() < deadline:
        try:
            r = requests.get(f"http://127.0.0.1:{port}/json/version", timeout=1)
            if r.ok:
                return r.json()
        except requests.RequestException:
            pass
        time.sleep(0.5)
    raise TimeoutError(f"CDP {port} 未就绪")
/json/version is Chromium's standard endpoint, and the response also contains webSocketDebuggerUrl, which can serve as a fallback source for the ws address.
When launching multiple environments in bulk, don't fire dozens of requests all at once. Launch them one by one, record each port separately, or leave a half-second to one-second interval between launches. The client needs time to allocate ports and spawn processes.
Cleanup: always call the stop endpoint
When the script ends (including abnormal exit), call the corresponding stop endpoint to close the environment. Skipping this step results in leftover processes: ports occupied, the environment showing as "running" in the client, and the next launch of the same environment failing outright. In Python, use try/finally; in Node, use process.on('exit') or wrap the main flow in try/catch and put the stop request inside.
Also note: calling browser.close() in scripts has different semantics across frameworks—some just disconnect, others actually close the browser. To have the client correctly record the environment status and properly persist session data, it's better to call the client's stop endpoint.
Troubleshooting order when you can't connect
- Request to 127.0.0.1 fails: the client isn't running, or the API service switch isn't on, or the port is wrong. First, access the API address directly in a browser to confirm.
- API reachable but launch returns an error code: the environment ID is wrong, the environment is already running, or it's currently occupied by another team member. Check the environment's current status in the client UI.
- Launch succeeds but ws can't connect: most likely you skipped the readiness check; add the
/json/versionpolling. If polling also times out, check if the port is a stale cached value. - Connected but page behavior is wrong: under Playwright, first confirm you didn't mistakenly create a new context; under Puppeteer, confirm the viewport wasn't changed by
defaultViewport. - Script runs but exit IP or timezone is wrong: this is no longer an API-layer issue, but the environment's proxy configuration layer. Check in the order of how to confirm exit ownership and timezone/language consistency after binding a proxy; if the exit IP shows as your local IP, refer to WebRTC and UDP channel troubleshooting.
Doing this in NexBrowser
NexBrowser's Local API is free and has no call limits. Selenium, Puppeteer, Playwright, as well as browser-use and Playwright MCP, can take over environments as described above—meaning to attach an AI Agent to a logged-in environment, it uses the same CDP channel, with no need to purchase additional call credits. For specific listening ports, route paths, and response fields, refer to the client's settings interface and the Local API feature page. Don't copy other products' documentation. The client currently offers a Windows version; macOS is still in development, which affects which machine you deploy your scripts on.
If you haven't installed the client yet, get it from the download page, manually create an environment and log in successfully, then connect via API—if the environment itself isn't configured properly, connecting a script will just automate failure.
If what you need is repetitive multi-account actions rather than writing code, first see whether how to build flows with no-code RPA is easier; if you've already decided to use Puppeteer, three ways to write wsEndpoint covers it in more detail.
A final reminder: the above are all connection methods for isolated operations and process automation on your own accounts. No API configuration guarantees "non-association," and script behavior itself must comply with the target platform's rules.


Comments(0)